Use the Permit Statistics page to examine data points, present those points in informative ways, and zoom to critical periods within the span of recorded data.
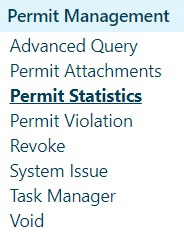
Navigate to the Permit Statistics screen by clicking the My Admin link then choosing the Permit Statistics link from the Permit Management pane.
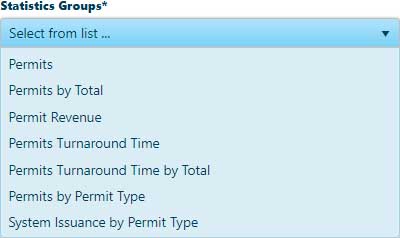
Expand the Statistics Groups drop-down and choose from the available options
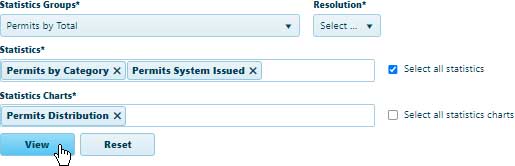
Your choice of Statistics Group will populate the options in the Statistics and Statistics Charts fields. To remove a value, click the X at the end of its title. When only the desired values remain, click the View button to create your Analytical Viewer.
Check the Select All Statistics box to include the entire Statistics Group in the Statistics field.
Check the Select All Statistics Charts box to include every chart in the Statistics Group.
Note: The system may take a few moments to put the Analytical Viewer together. A greater volume of data means a longer wait before the viewer appears on the page.
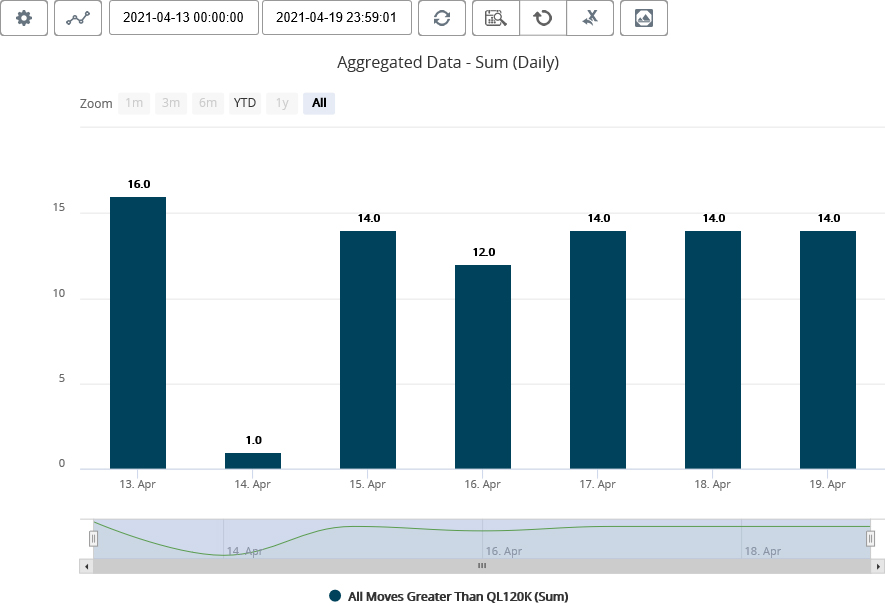
For the following Statistics groups, Bar Chart will be displayed
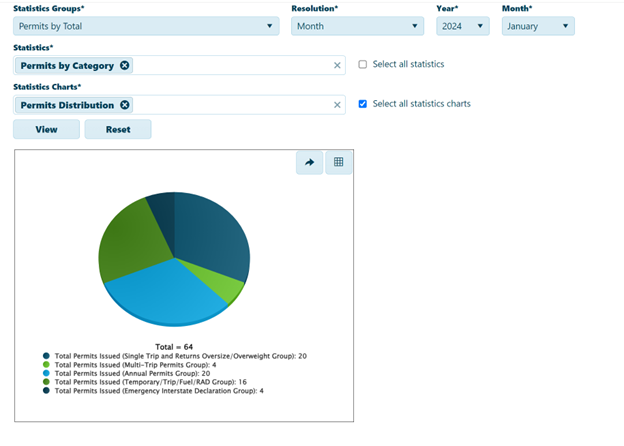
For the following Statistics groups, Pie Chart will be displayed
Note: Select the resolution from the drop-down list