Use the Date fields and the Trace Navigator to control the period of presented data. Use the Synchronize feature to zoom the displayed data to the designated period.
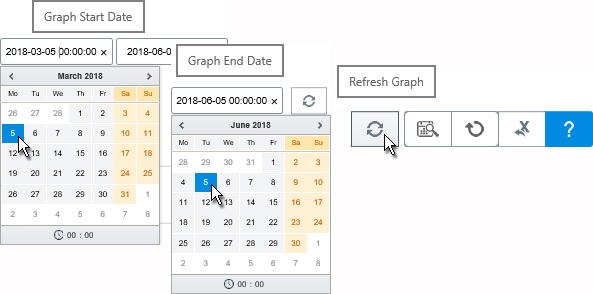
Click in the Graph Start Date field then enter a date in YYYY-MM-DD format or choose a date from the calendar. Repeat this process in the Graph End Date field then click the Refresh Graph icon.
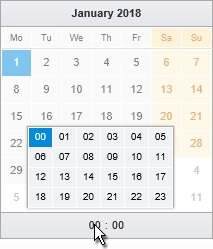
Note: If you are dealing with high volume data and require hour and minute values in the Start/End Date field, then click on the hour indicator at the bottom of the calendar pop-up. Options 00 to 23 become available, so select the desired hour. Click on the minute indicator then choose from options 00 to 55.
Note: With larger date ranges, more zoom options become available. Click these buttons to access different zoom ranges:
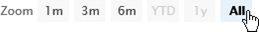
One month
Three months
Six Months
Year To Date
One Year
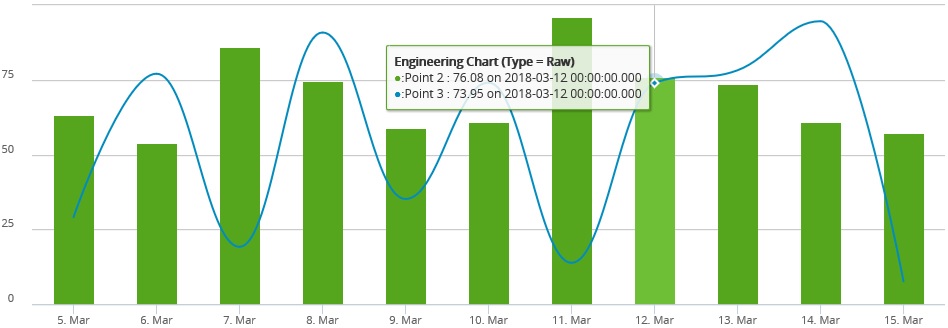
The chart displays data for the defined period.
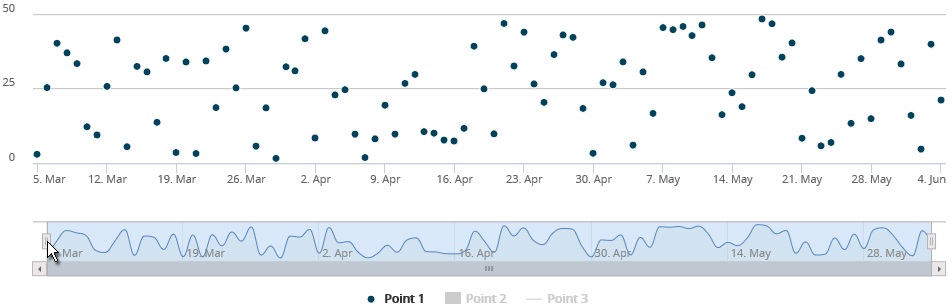
The Navigator Trace that runs just below the chart contains a representation of the data set and gives an indication of the current zoom level. Slide the grips at either end to expand or restrict the period of data presented in the chart.
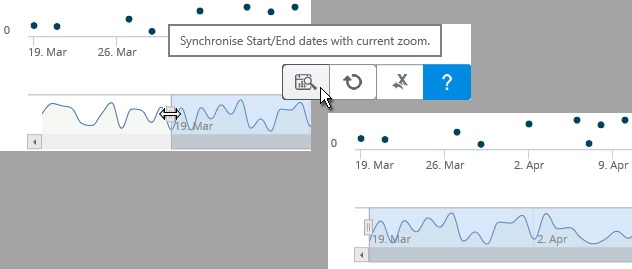
Drag the left grip of the Navigator Trace in either direction then click the Synchronise Start/End Dates with Current Zoom icon. The chart zooms in or out to establish the position of the grip as the new Start Date for the period of presented data.
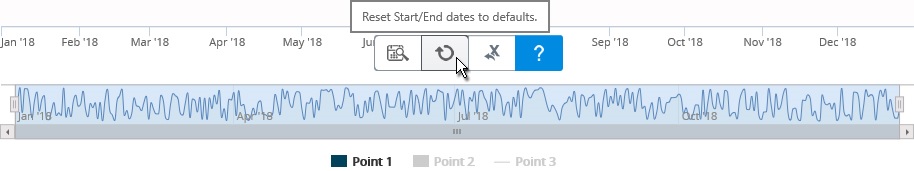
Click the Reset Start/End Dates to Defaults icon to return the full span of data.
Move your cursor into the chart and hover over a data point to see the information represented by the line or column or spline.