Use the Chart Details features to review point information and presentation.
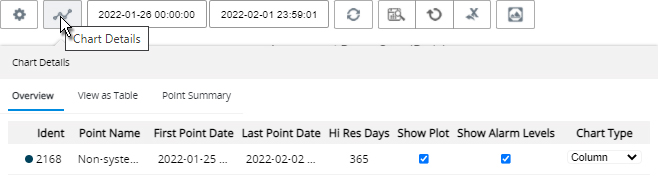
Click the Chart Details icon.
The Ident column shows the color for each point on the chart.
Check the Show Plot Box for each point that you wish to appear in the chart. Conversely, removing the check from the box hides the point's data.
If your chart features Alarm Levels, check the boxes for those you wish to appear in the chart.
If your Points are configured with alarms that are enabled, check the boxes for those you wish to appear in the chart.
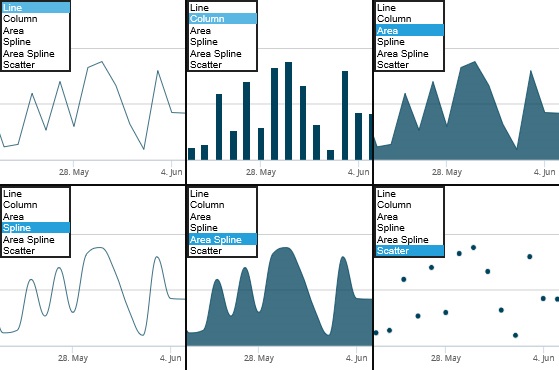
Your choice from the Chart Type drop-down determines the appearance of point data.
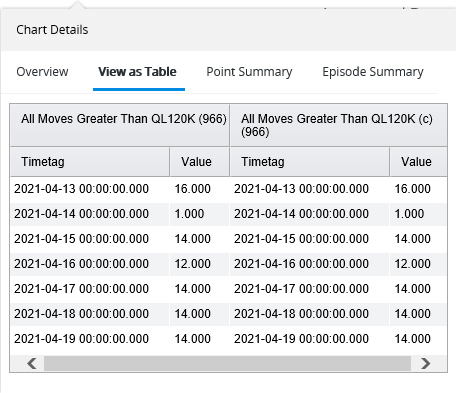
The View as Table tab displays all values on the chart in a table. Each Point/Indicator is displayed along the top with 2 columns: a Timetag and a Value. Clicking in any Timetag or Value column sorts the column soonest to latest or least to greatest.
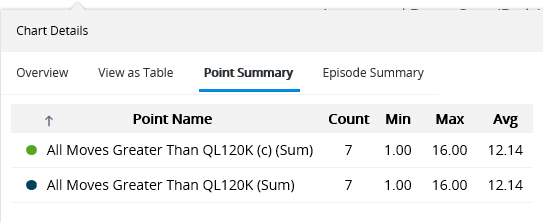
Open the Point Summary tab to see a Count of how many values appear in the chart. Columns display Min, Max, and Avg values for the selected period per Point/Indicator. When you drag the grips of the Navigator Trace, these values update accordingly.
Click a column heading to sort the values beneath it.